Advancing Soybean Phenotyping Through Temporal 3D Digital Monitoring
High-Throughput Time-Series 3D Analysis of Soybean Nutrient Response
A research proposal for precision agriculture
Date:
Course:
Presentation Outline
- Motivation & Problem Statement - The need for advanced phenotyping
- Key Contributions - Our proposed innovations
- Approach & Evaluation - Methodology and validation
- Expected Results & Impact - Anticipated outcomes and significance
- Future Outlook - Broader applications and vision
Motivation: Soybean's Global Importance
A Strategic Global Crop
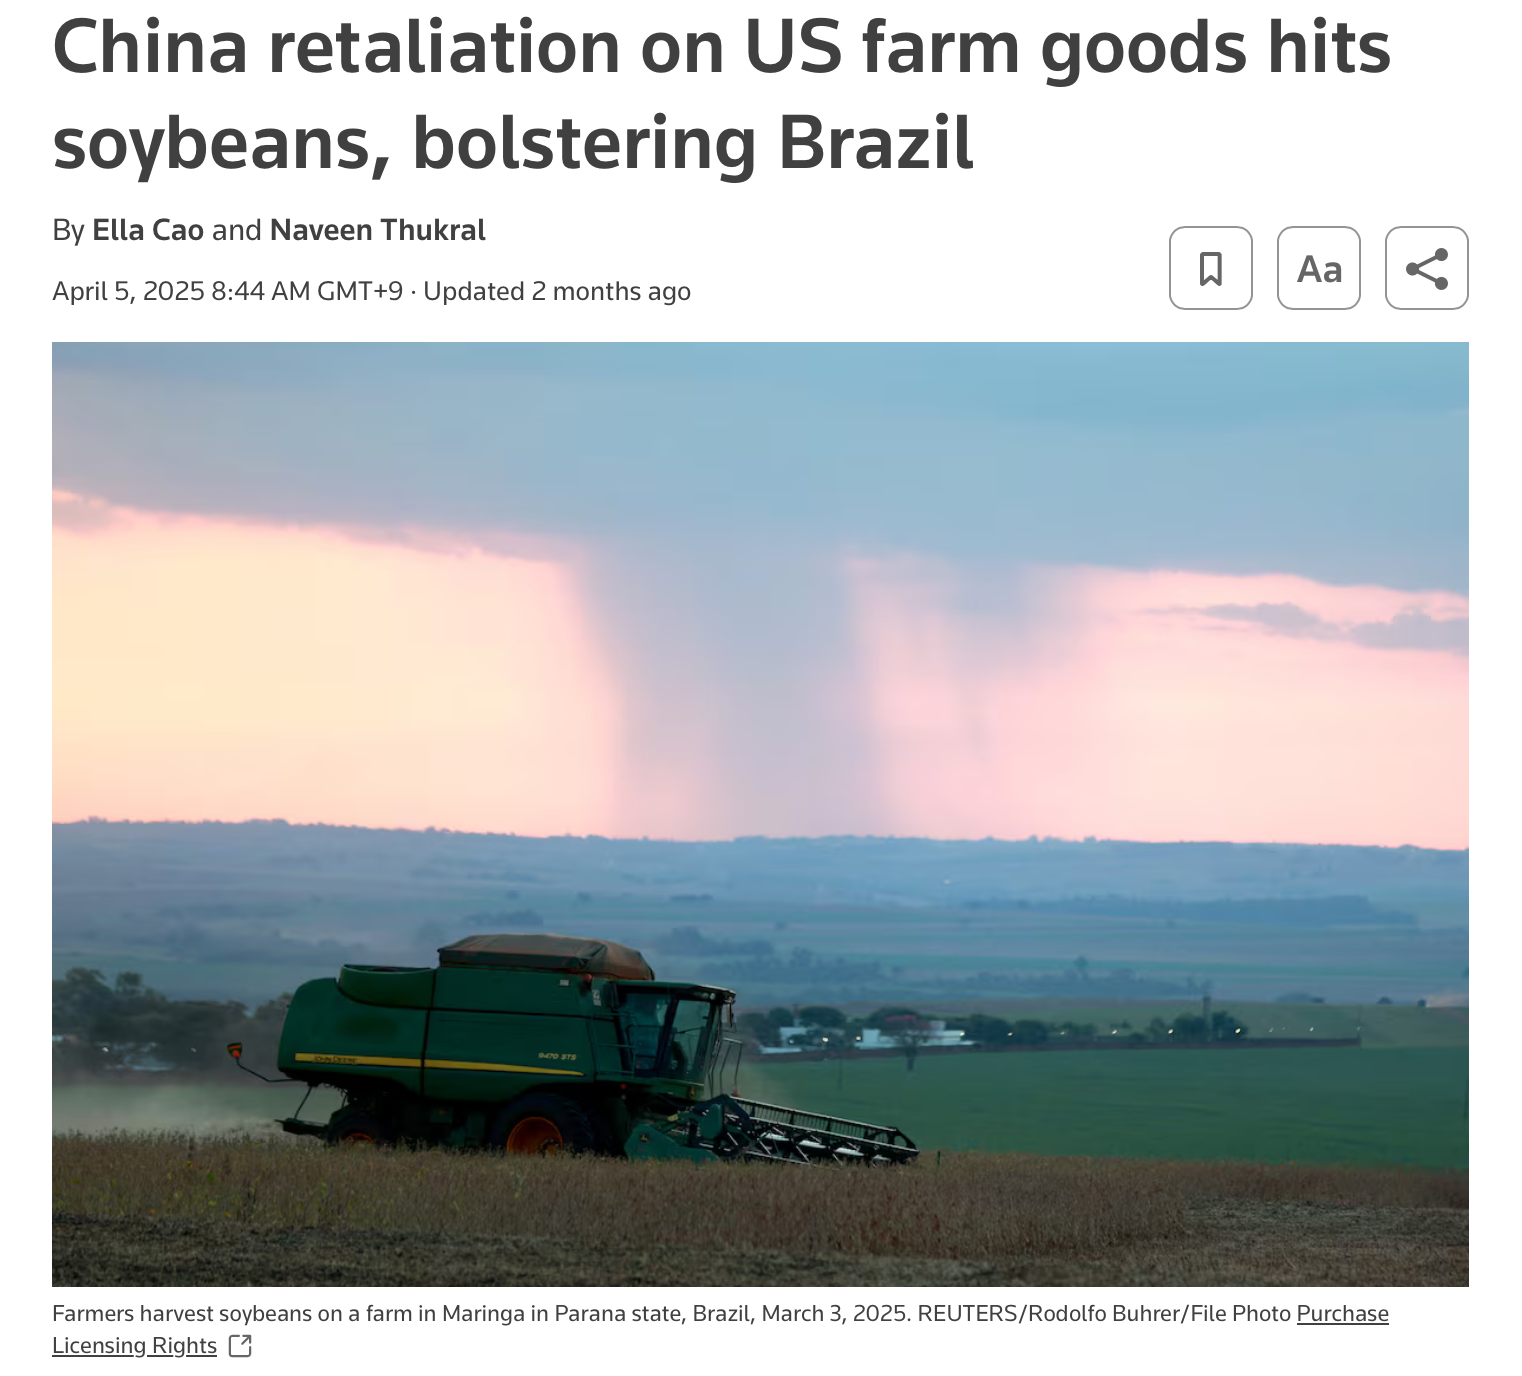
Soybeans are vital for global agriculture, trade, and food security, with significant economic impact reflected in international markets.
Global Market Snapshot
- ~$170B global market (2024 est.), >$250B by 2033.
- Key export crop, crucial for multiple national economies.
- High import demand (e.g., China imports ~60% global trade).
Motivation: Soybean's Nutritional & Agricultural Value
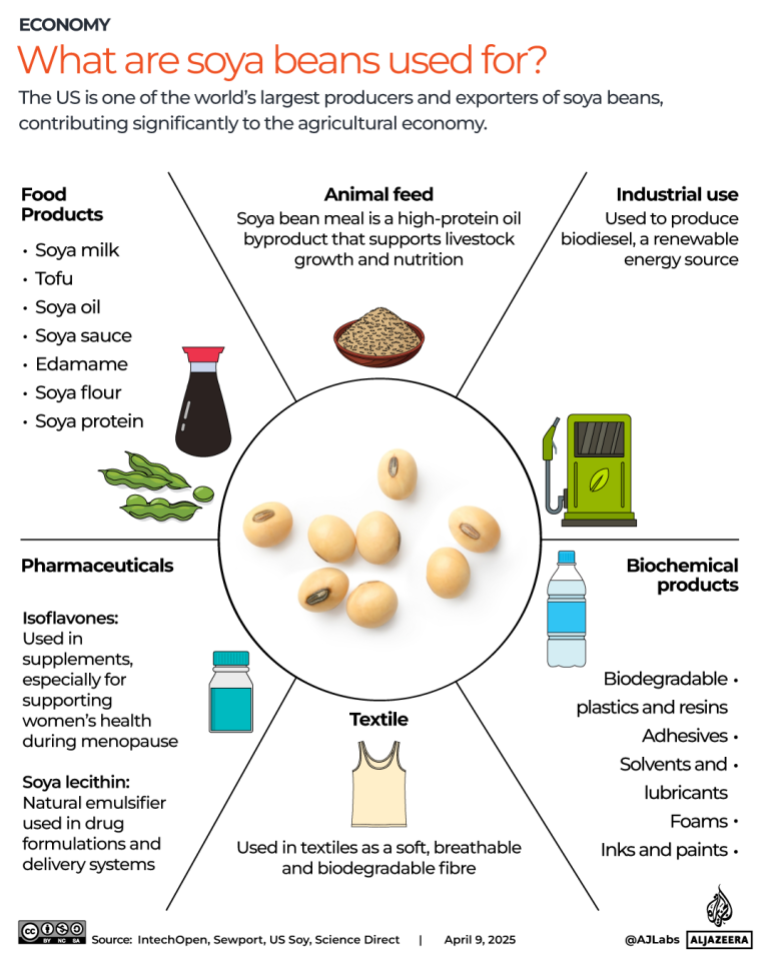
Why is soybean critical?
- Protein Source: ~40% protein content.
- Animal Feed: Core component (~70% global output).
- Food Security: Essential amino acids for human nutrition.
- Versatile Use: Numerous food & industrial applications.
Problem: The Phenotyping Bottleneck
Traditional phenotyping (manual, 2D measurements) is slow, labor-intensive, and misses crucial 3D architectural and temporal dynamics vital for understanding plant growth.
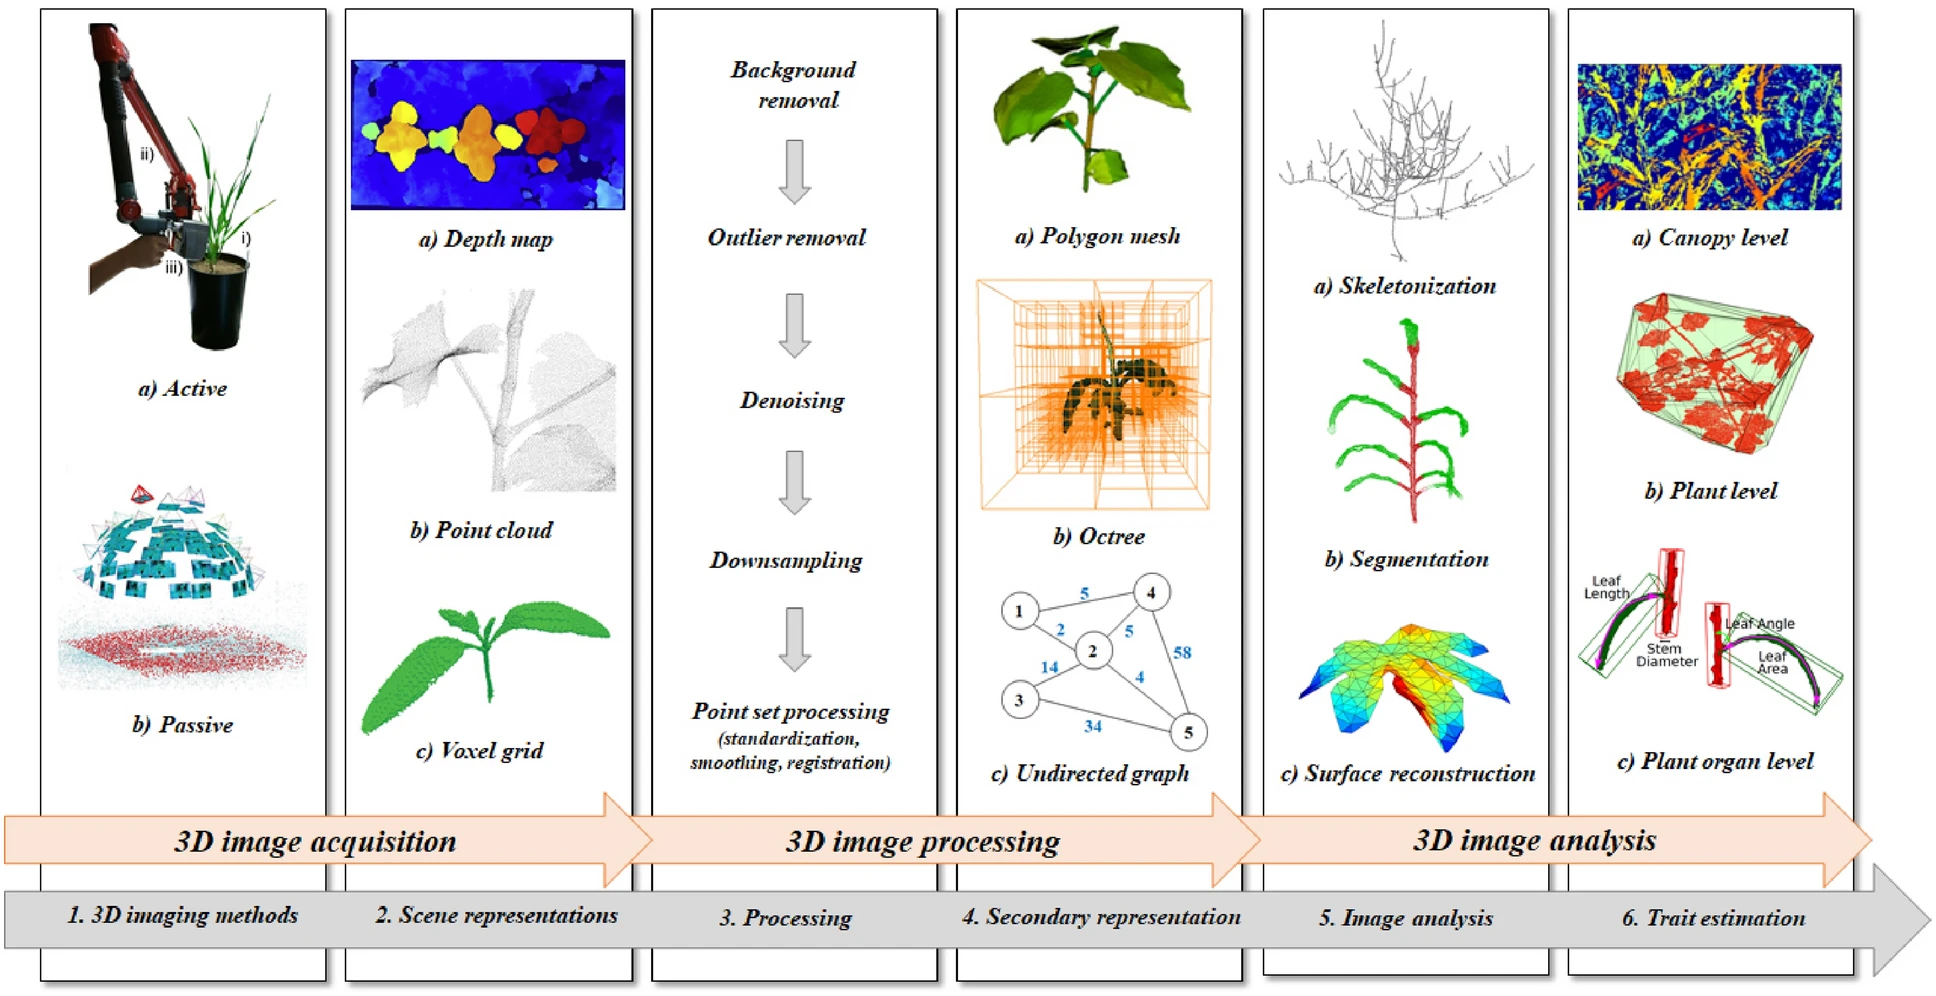
Typical 3D Plant Phenotyping Pipeline
Current Limitations
- Time-intensive & Laborious: Slows research.
- Limited Scope: Mostly 2D, misses 3D architecture.
- Scalability Issues: Impractical for large experiments.
- Data Gaps: Temporal changes often overlooked.
Need for Advanced Methods
- High-Throughput: Rapid, automated data capture.
- Comprehensive 3D Detail: Accurate architecture.
- Temporal Analysis: Dynamic growth tracking.
- Precision & Accuracy: Quantitative trait data.
Problem: Understanding Nutrient Impact
Knowledge Gaps Addressed
- Dynamic 3D morphological impact of nutrient uptake.
- Precise timing of nutrient effects on key growth stages.
- Quantifying complex architectural changes due to nutrition over time.
- Early 3D indicators for yield/biomass forecasting.
Our Research Focus with 3DGS
- Temporal 3D Models: Frequent, high-fidelity growth tracking.
- Multi-Trait Analysis: Comprehensive 3D traits from models.
- Nutrient Response Dynamics: Linking 3D changes to treatments over time.
- Predictive Phenomics: Early 3D traits for performance forecasting.
Context: Economic & Environmental Significance
Optimizing fertilizer use (global spend >$200B annually) via precise nutrient understanding can yield major economic savings and reduce environmental impact. (FAO, 2023)
Our Vision
Digital Plant Twins"]; C --> Analysis_Header["Phenotypic Trait Analysis"]; subgraph Phenotypic_Trait_Analysis ["Phenotypic Trait Analysis"] direction LR subgraph GeometricTraits["Geometric & Morphological"] direction TB D_Header_Geo(("📏 Traits")); D1["Height, Width, Volume"] D2["Leaf Area, Count, Angle"] D3["Stem Diameter, Internodes"] D4["Branching, Topology"] D_Header_Geo --> D1; D_Header_Geo --> D2; D_Header_Geo --> D3; D_Header_Geo --> D4; end subgraph TemporalTraits["Temporal Dynamics"] direction TB D_Header_Temp(("📈 Traits")); D5["Growth Curves & Rates"] D6["Developmental Staging"] D7["Change Detection Stress"] D_Header_Temp --> D5; D_Header_Temp --> D6; D_Header_Temp --> D7; end end Analysis_Header --> GeometricTraits; Analysis_Header --> TemporalTraits; TemporalTraits --> App_Header["Applications & Decisions"]; GeometricTraits --> App_Header; subgraph Applications_Decisions ["Applications & Decisions"] direction LR subgraph Breeding["🧬 Breeding & Genetics"] direction TB E1["High-Throughput Phenotyping"] E2["Trait-Assisted Selection"] end subgraph CropManagement["🌾 Agronomy & Crop Mgmt"] direction TB E3["Precision Nutrition/Inputs"] E4["Early Stress Detection"] E5["Growth Monitoring & Yield Forecast"] end subgraph Research["🔬 Research & Discovery"] direction TB E6["GxExM Interaction Studies"] E7["Validating Growth Models"] end end App_Header --> Breeding; App_Header --> CropManagement; App_Header --> Research; %% Styling classDef default font-family:'Montserrat',sans-serif,font-weight:500; style Analysis_Header fill:#e3f2fd,stroke:#1976d2,stroke-width:2px style App_Header fill:#fff3e0,stroke:#f57c00,stroke-width:2px style C fill:#e8f5e9,stroke:#388e3c,stroke-width:2px,font-weight:bold style D_Header_Geo fill:#f3e5f5,stroke:#7b1fa2,stroke-width:1.5px style GeometricTraits fill:#f3e5f5,stroke:#7b1fa2,stroke-width:1px,color:#333 style TemporalTraits fill:#f3e5f5,stroke:#7b1fa2,stroke-width:1px,color:#333 style D_Header_Temp fill:#f3e5f5,stroke:#7b1fa2,stroke-width:1.5px style D1 fill:#f3e5f5,stroke:#7b1fa2 style D2 fill:#f3e5f5,stroke:#7b1fa2 style D3 fill:#f3e5f5,stroke:#7b1fa2 style D4 fill:#f3e5f5,stroke:#7b1fa2 style D5 fill:#f3e5f5,stroke:#7b1fa2 style D6 fill:#f3e5f5,stroke:#7b1fa2 style D7 fill:#f3e5f5,stroke:#7b1fa2 style Breeding fill:#ffebee,stroke:#c62828,stroke-width:1px,color:#333 style CropManagement fill:#ffebee,stroke:#c62828,stroke-width:1px,color:#333 style Research fill:#ffebee,stroke:#c62828,stroke-width:1px,color:#333 style E1 fill:#ffebee,stroke:#c62828 style E2 fill:#ffebee,stroke:#c62828 style E3 fill:#ffebee,stroke:#c62828 style E4 fill:#ffebee,stroke:#c62828 style E5 fill:#ffebee,stroke:#c62828 style E6 fill:#ffebee,stroke:#c62828 style E7 fill:#ffebee,stroke:#c62828
Benefits for Agricultural Stakeholders
For Researchers
- Enhanced Data: Higher quality & throughput, non-destructive.
- Novel Insights: Uncover complex growth dynamics.
- Standardized Phenotyping: Improved research quality.
- Temporal Analysis: Track developmental trajectories.
For Farmers & Agronomists
- Optimized Resource Use: Data-driven input management.
- Early Stress Detection: Timely interventions.
- Improved Yield Forecasting: Better predictions.
- Enhanced Decision Support: Precise management.
Bridging Advanced Technology and Practical Application
Our work aims to make high-resolution temporal 3D monitoring accessible and practical via 3DGS, facilitating precision agriculture.
Key Contributions of This Research
Academic
- Pioneering application of 3DGS for soybean phenotyping.
- Development of a novel, low-cost 3DGS-centric reconstruction pipeline.
- Quantitative analysis of temporal 3D growth patterns under nutrient stress.
- Comparative evaluation of 3DGS against MVS/NeRF for plant scanning.
Practical
- Low-cost, RGB camera-based 3D phenotyping system.
- Significantly faster data processing compared to NeRF, more complete than MVS.
- Methodology for extracting multiple key agronomic traits from 3DGS models.
- Framework for field-adaptable, high-throughput phenotyping.
Long-term
- Enabling data-driven precision nutrient management.
- Potential to accelerate crop breeding cycles via rapid trait assessment.
- Contribution to sustainable farming practices and resource optimization.
- Foundation for broader adoption of digital agriculture technologies.
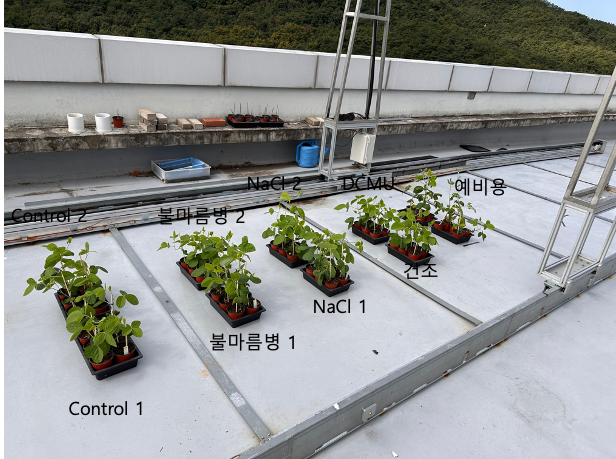
Approach: Experimental Design
Soybean Nutrient Response Study
Investigating nutrient impacts on soybean seedling growth using temporal 3D phenotyping via our 3DGS pipeline for reconstruction and trait analysis.
Experimental Setup
- Plants: 30 soybean (Glycine max cv.).
- Treatments: 3 groups (Control, Nutrient Mix 1 & 2).
- Duration: 4-6 weeks (seedling to early veg./repro. stages).
- Imaging: ~3x weekly, multi-camera, 360° coverage.
Focus of Investigation
- Key architectural development stages.
- 3D responses during nutrient-sensitive phases.
- Early 3D indicators of later performance.
- Quantitative trait dynamics (height, LA, vol.).
Approach: 3DGS Reconstruction & Trait Extraction
Workflow: Image to Traits
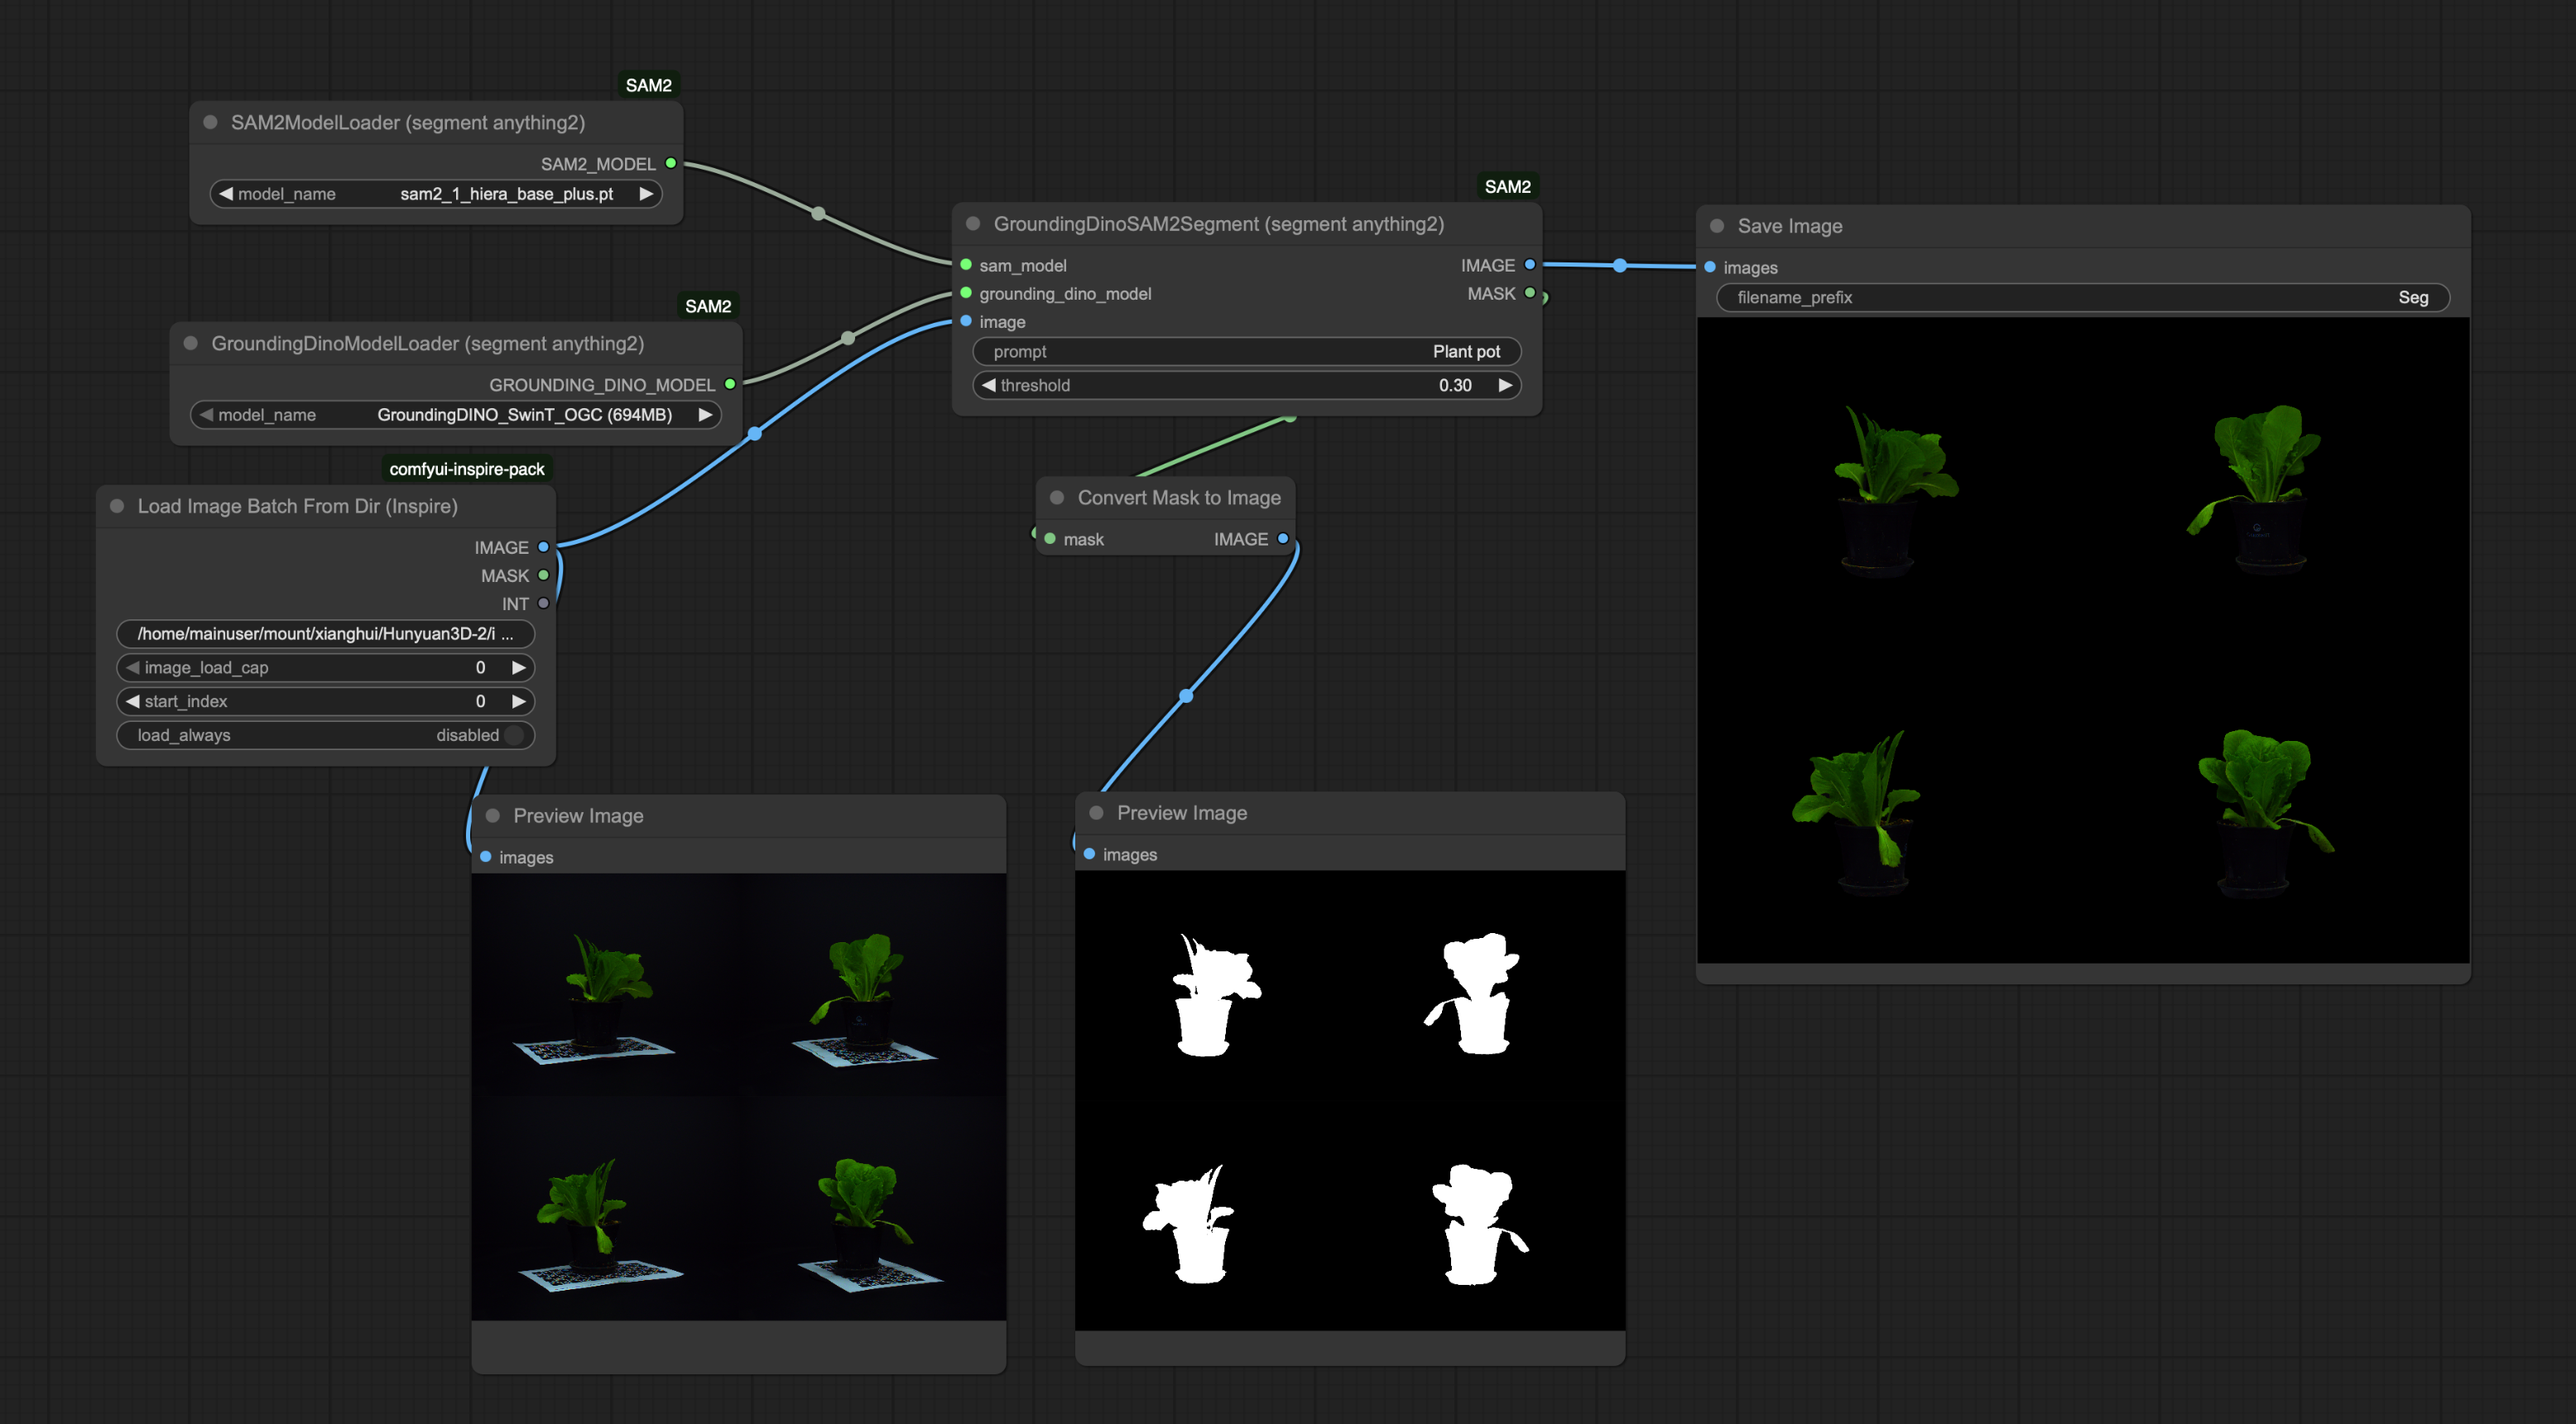
Multi-view RGB images (~108 per plant/session via portable phenobox & turntable) are processed through our 3DGS pipeline.
Data Acquisition & Reconstruction
- Multi-view RGB Images: Systematic coverage (turntable & camera array).
- Consistent Conditions: Stable lighting & background.
- SfM (COLMAP): Camera poses & sparse point cloud.
- 3DGS Core: SfM outputs initialize 3DGS for fast, high-fidelity, explicit 3D models.
Trait Extraction from 3DGS Models
- Key Traits: Plant Height, Leaf Area (segmented/fitted), Stem/Plant Volume (hull/skeleton), Node Count & Branching (skeletal analysis).
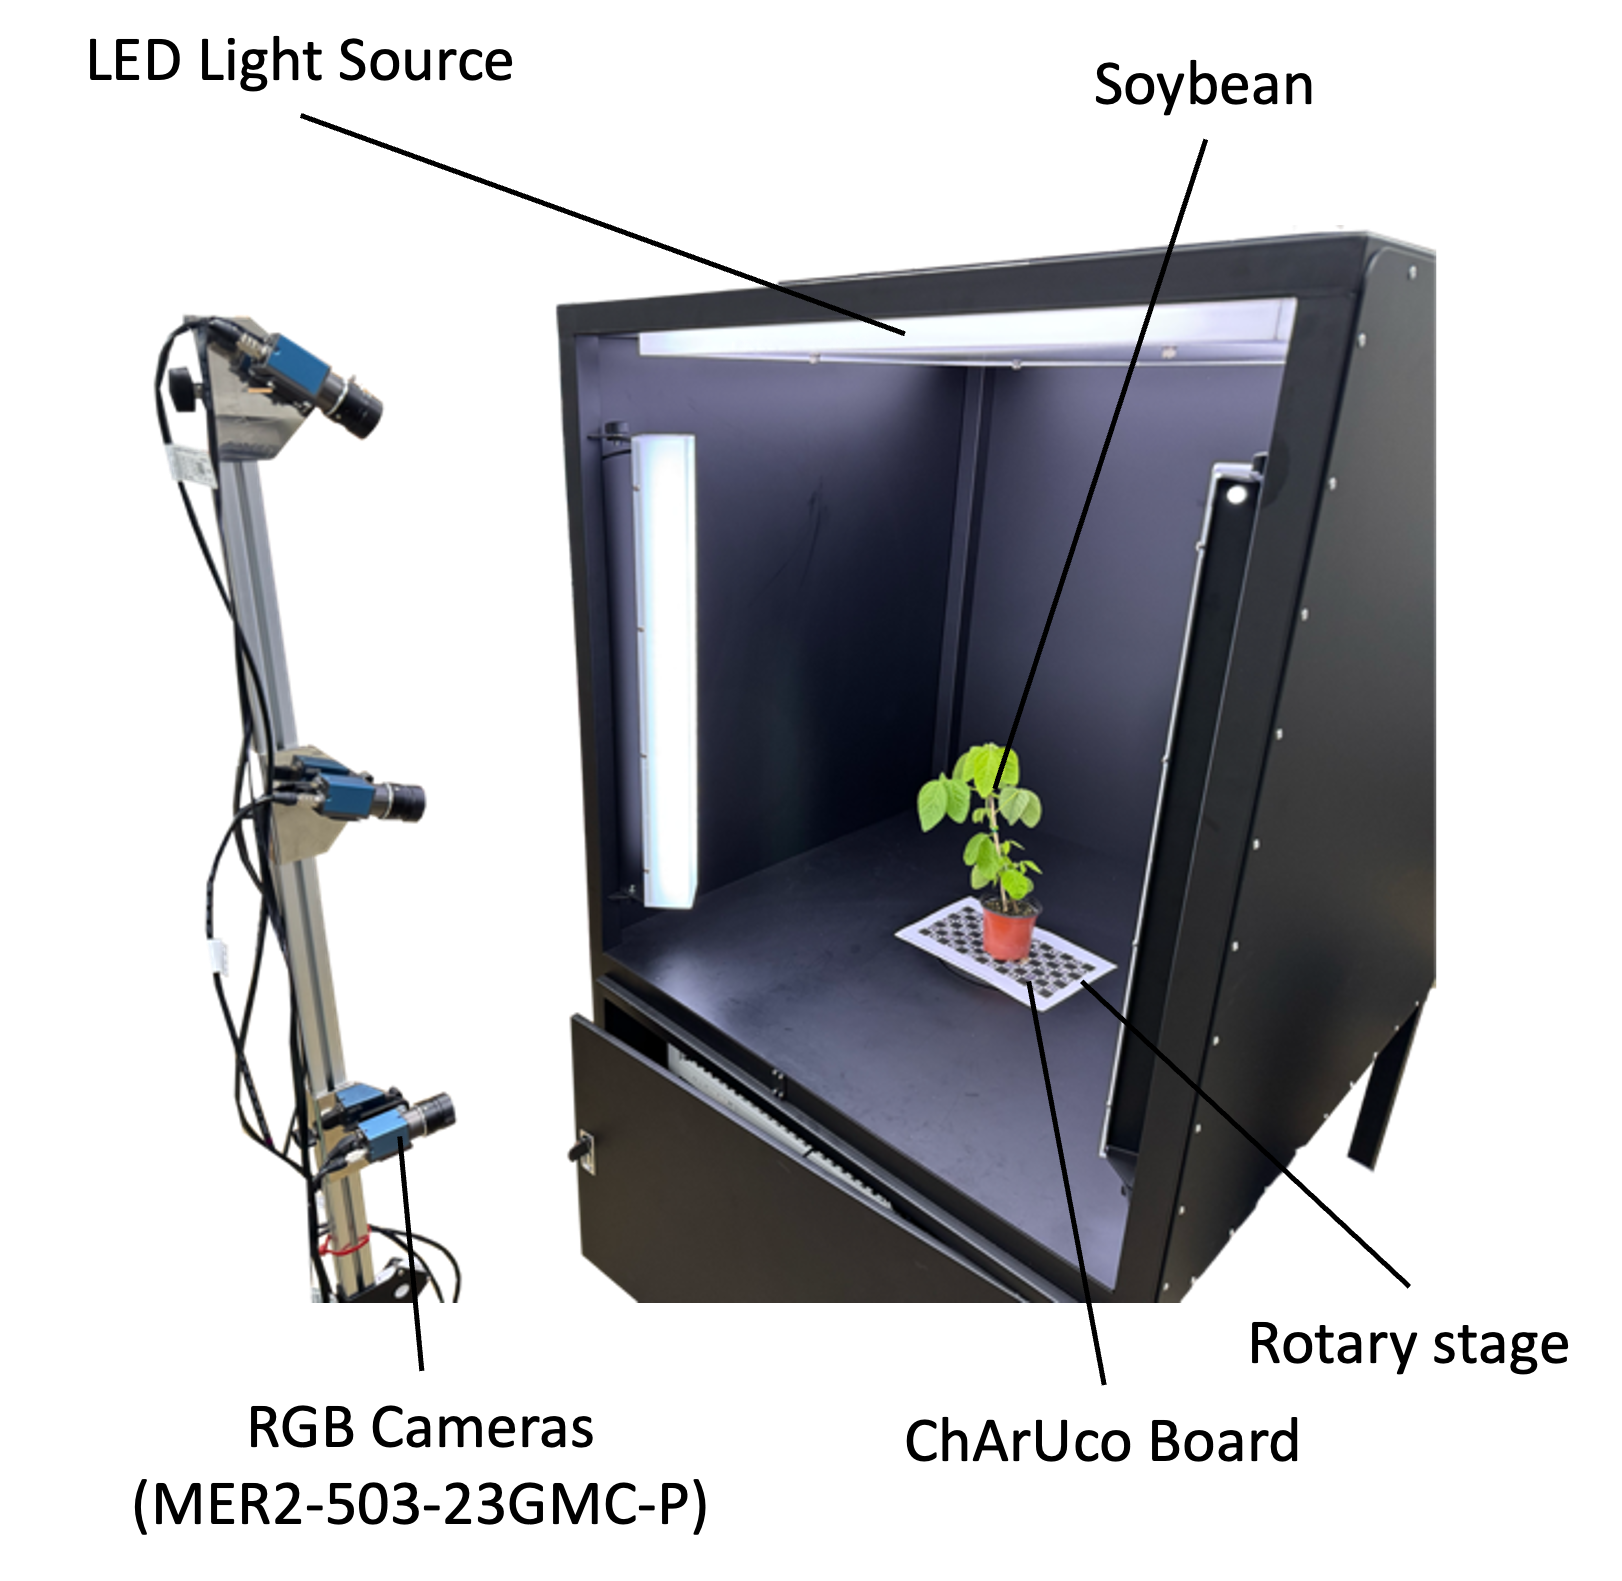
Automated 3D phenotyping system concept.
Evaluation: Validation & Benchmarking
Technical & Biological Validation
- Trait Accuracy: 3DGS vs. manual (Target R² >0.90, error <10-15%).
- Reconstruction Quality: Visual fidelity (PSNR/SSIM), geometric consistency.
- Treatment Effects: ANOVA for significant 3D trait differences.
- Temporal Tracking: Growth curves & developmental change analysis.
Methodological Benchmarking
- vs. MVS (COLMAP): Model completeness, noise, plant structure detail.
- vs. NeRF (InstantNGP): Quality, speed, precision, trait extraction ease.
- Efficiency: Processing time/plant (3DGS vs. MVS vs. NeRF). Target <30-60 min for 3DGS.
Key Performance Indicators (KPIs) for 3DGS Pipeline
Speed: Reduced time vs. NeRF. | Accuracy: Sub-mm trait precision. | Detail: Fine structure capture. | Throughput: 50+ traits. | Temporal Fidelity: Reliable tracking.
Expected Results: Performance of 3DGS Pipeline
| Method | Time (per plant) | Accuracy/Detail | Model Type | Trait Extraction | Practicality |
|---|---|---|---|---|---|
| Manual | Days/Weeks | Low (Human error, 2D limits) | N/A | Limited, Destructive | Low Throughput |
| Traditional MVS | Hours (Dense) | Moderate (Often sparse/noisy for plants) | Explicit (Point Cloud/Mesh) | Incomplete / Difficult | Moderate |
| NeRF Methods | Hours (Training) | High (Visual), Geometric variable | Implicit (Neural Field) | Challenging / Indirect | Computationally Intensive |
| Our 3DGS Pipeline | Minutes (e.g. <30-60) | High (Target Sub-mm), Detailed | Explicit (Gaussians/Points) | Direct & Comprehensive | High Throughput, Field-adaptable |
Expected Impact: Biological & Agricultural
Anticipated Biological Discoveries
- Detailed temporal 3D quantification of soybean nutrient response.
- Early 3D growth indicators predictive of later performance.
- Modeling resource allocation under varied nutrient regimes.
- Defining critical windows for nutrient impact on 3D architecture.
Projected Agricultural Advancements
- Foundation for data-driven precision nutrient management.
- Accelerating crop breeding via rapid, accurate phenotyping.
- Improved yield optimization & resource use efficiency models.
- Support for sustainable agriculture (reduced input waste).
Future Outlook & Broader Impact
The efficient 3DGS pipeline developed can be a foundational technology for wider applications in temporal agricultural monitoring, research, and practice, beyond this soybean study.
Potential Extensions
- Other key crops (wheat, rice, maize).
- Diverse stress phenotyping (drought, disease).
- Field deployment, breeding, commercial ag.
- Sensor fusion (thermal, hyperspectral).
- AI-driven trait extraction & prediction.
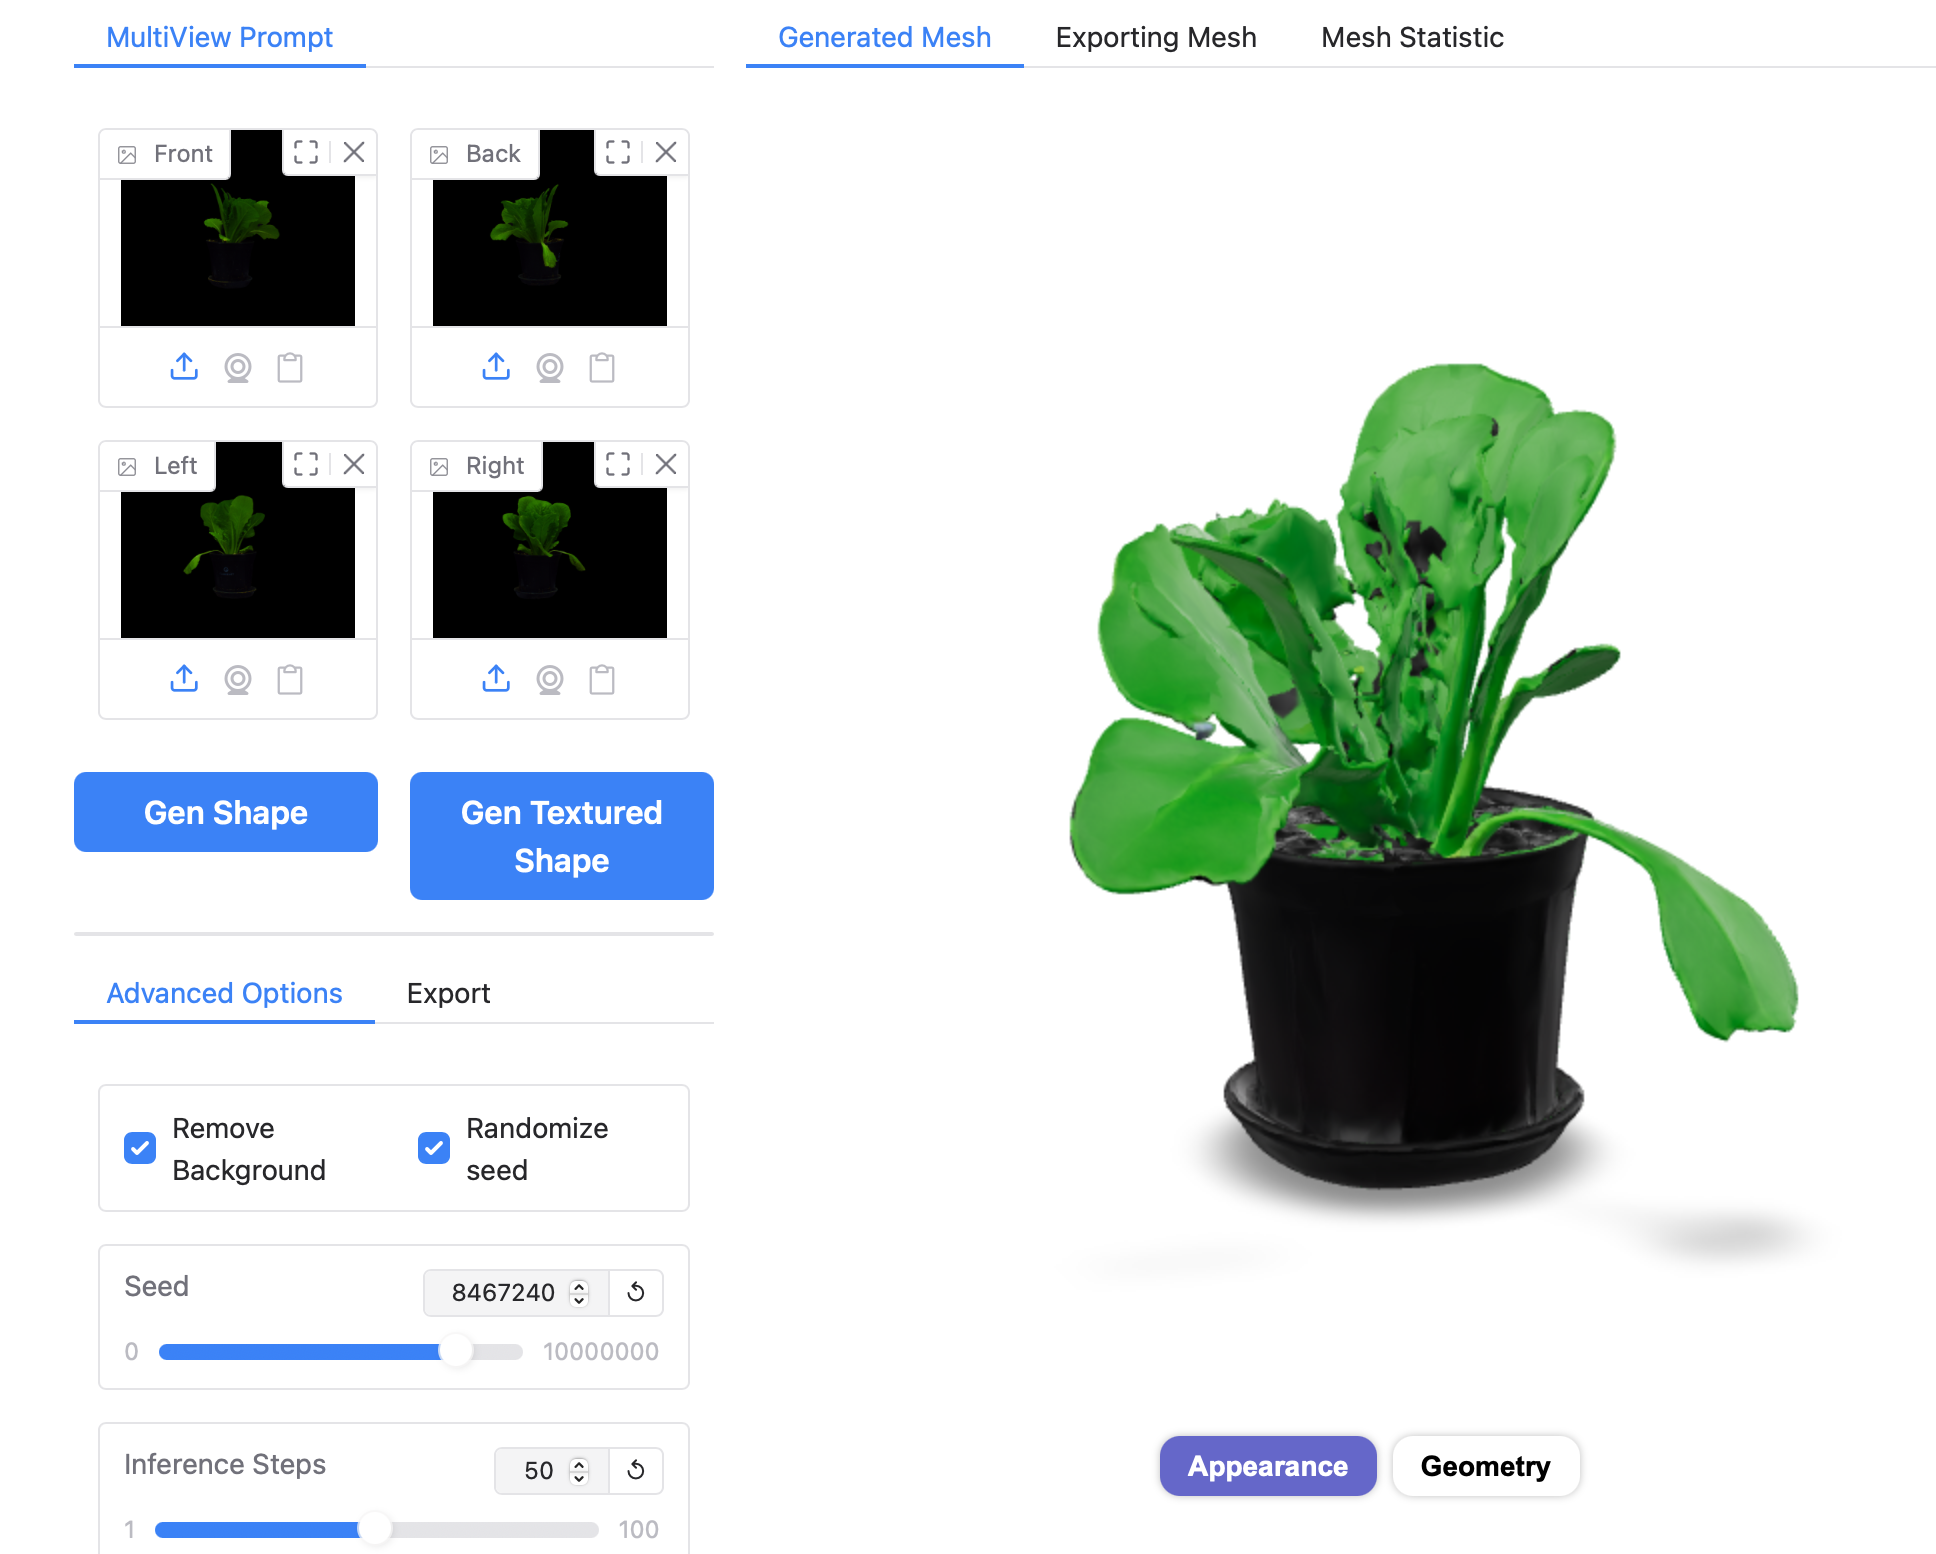
- Generative AI (Hunyuan3D, Matrix3D) for model refinement/augmentation from sparse data (noting current precision limits).
Digital Ag Contribution
- Sustainable food production.
- Reduced environmental footprint.
- Democratizing precision ag tools.
- Enhancing climate resilience.
- Foundation for ag "digital twins".